
I’ve been focusing on the viewership lately with all of the videos, and lost some focus on the readership. Smaller group they are, but they’re my OG followers. So yeah, bringing articles back.
I do a lot of risk analyses, some formal, some not, and usually when I’m doing that a tree’s health is a factor in that. This article is going over the very first thing I see when I’m assessing a tree, regardless of the nature of the assessment.
A very simple metric I’ve called Net Leaf Area. And in this video, I’ll explain it. Maybe you’ll find it helpful. The concept is pretty simple.
Net Leaf Area is one of the first characteristics I evaluate first (sort of subconsciously now at this point) because it provides a general indication of the tree's overall vitality and helps inform the remainder of the assessment.
Relative to recent history, is the tree gaining leaf area? Is it losing leaf area? Remaining the same?
I’ve seen a metric called Leaf Area Index, but I think Net Leaf Area better describes what it is I’m looking for. And this isn’t a perfect fit, I’ve sort of adapted some things.
But real quick
LAI measures total foliage density per unit of ground when assessing trees. In other words, how much shade are they casting. LAI is used in horticulture and ag for other stuff too.
They use optical sensors or those weird little dome things to measure that (a densitometer). I think some apps might exist for this purpose now, dunno if they’re accurate or not.
I’ve thought about using these tools in my own health assessments to monitor canopy density over time too, but haven’t found a need for that degree of precision just yet. But I can see some criticisms for this technique; relying on shade from the sun. You might need identical conditions to compare measurements year over year, same time of year, etc. Sort of tricky I bet.
But yeah, in theory you could use this in arboriculture if you’re monitoring the efficacy of a certain treatment you plan to do for a few years. Other metrics too, but this could be one among a panel of ‘em. Over time the crown density has improved x-percentage as we've treated the tree, something like that. Or conversely, if you don’t see improvement—if it worsens—that can inform you to change course.
One metric among many, ya know? Sometimes one metric will be more useful, sometimes it won't be. That's why we have lots and we use a few relevant ones depending on our situation.
Back on track
So I haven’t seen the term Net Leaf Area used before in our context. And I think it is really simple, and it might be a better question than asking “how much of the crown is dead or alive?”
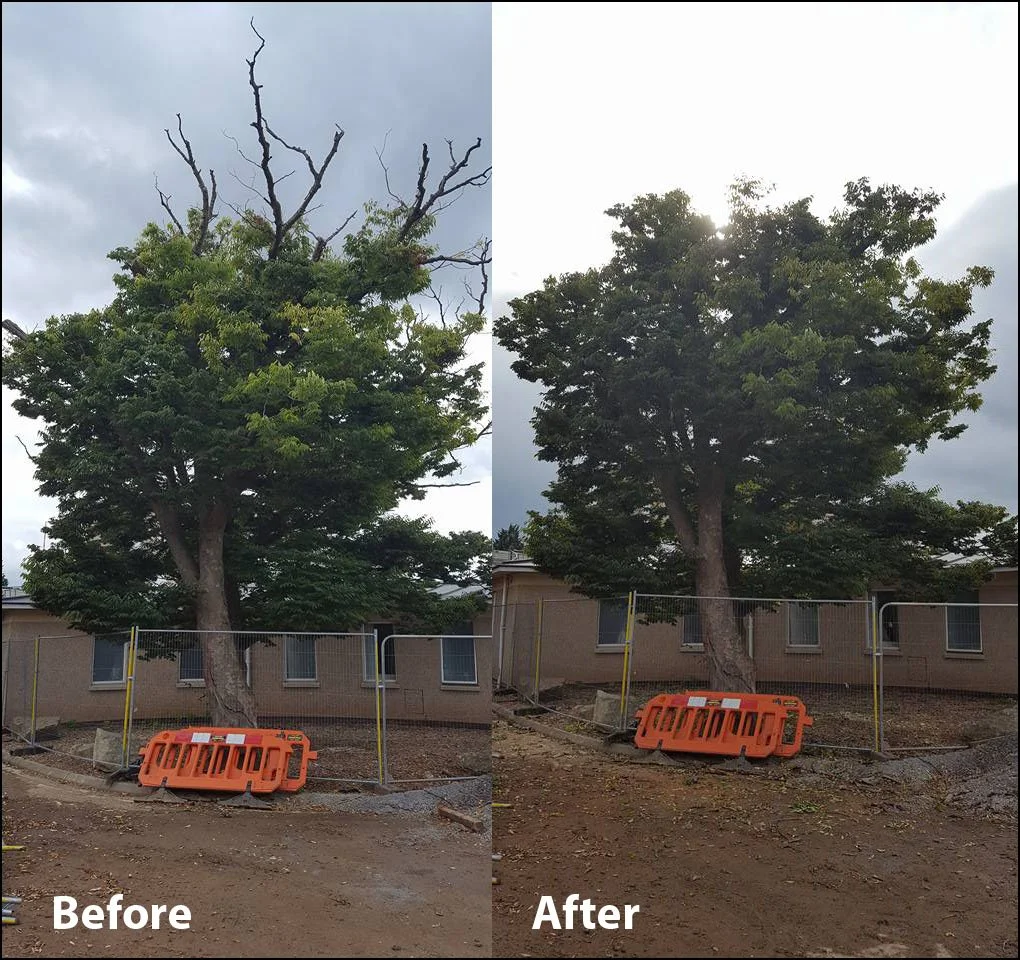
Photo not taken by Tree First. Just was a useful before and after for this explanation. (Image Source)
If I’m assessing a tree’s health, does a tree with dead stems in its crown suddenly become healthier when it lacks them?
Is this tree healthier than this tree?
If it was, then my assessment of this tree before being pruned and after being pruned would be different. Right? Even if it happened on the same day.
This is why dead wood on its own is not a valuable metric for measuring tree health.
My assessment would change if dead wood were a metric for health.
Once the tree part is totally dead, it is biologically separated from the tree. It isn’t “stealing” any energy away from the living parts.
When you’re assessing if a tree is healthy or not you’re really almost only looking at just the living parts of the tree. The dead parts are no longer the tree. No longer part of the tree.
You following me?
Physically attached maybe, but biologically detached if the dying process of that stem is complete and healthy and normal. Abscission and cladoptosis and stuff.

Is the sprinter on the left more or less healthy than the sprinter on the right?
Is a paralympian less healthy than anyone else? Are they less healthy than someone who has both legs?
I don’t know. To find that out, you’d compare the qualities of the living parts, and you’d exclude the missing parts.
Not a perfect analogy but you get what I’m saying lol.
There can be health clues and other good information on the dead stems.
Distribution, placement, size and speed of dead wood are also diagnostically helpful, but they’re helpful relative to the remaining parts of the plant.
Which leads me nicely to say that Net Leaf Area is a better contextual health assessment metric than simply looking for the presence of dead stems.
Is the tree, relative to recent years, increasing its photosynthetic area? Is it increasing its Net Leaf Area? Or is it decreasing its Net Leaf Area?
How do you tell?
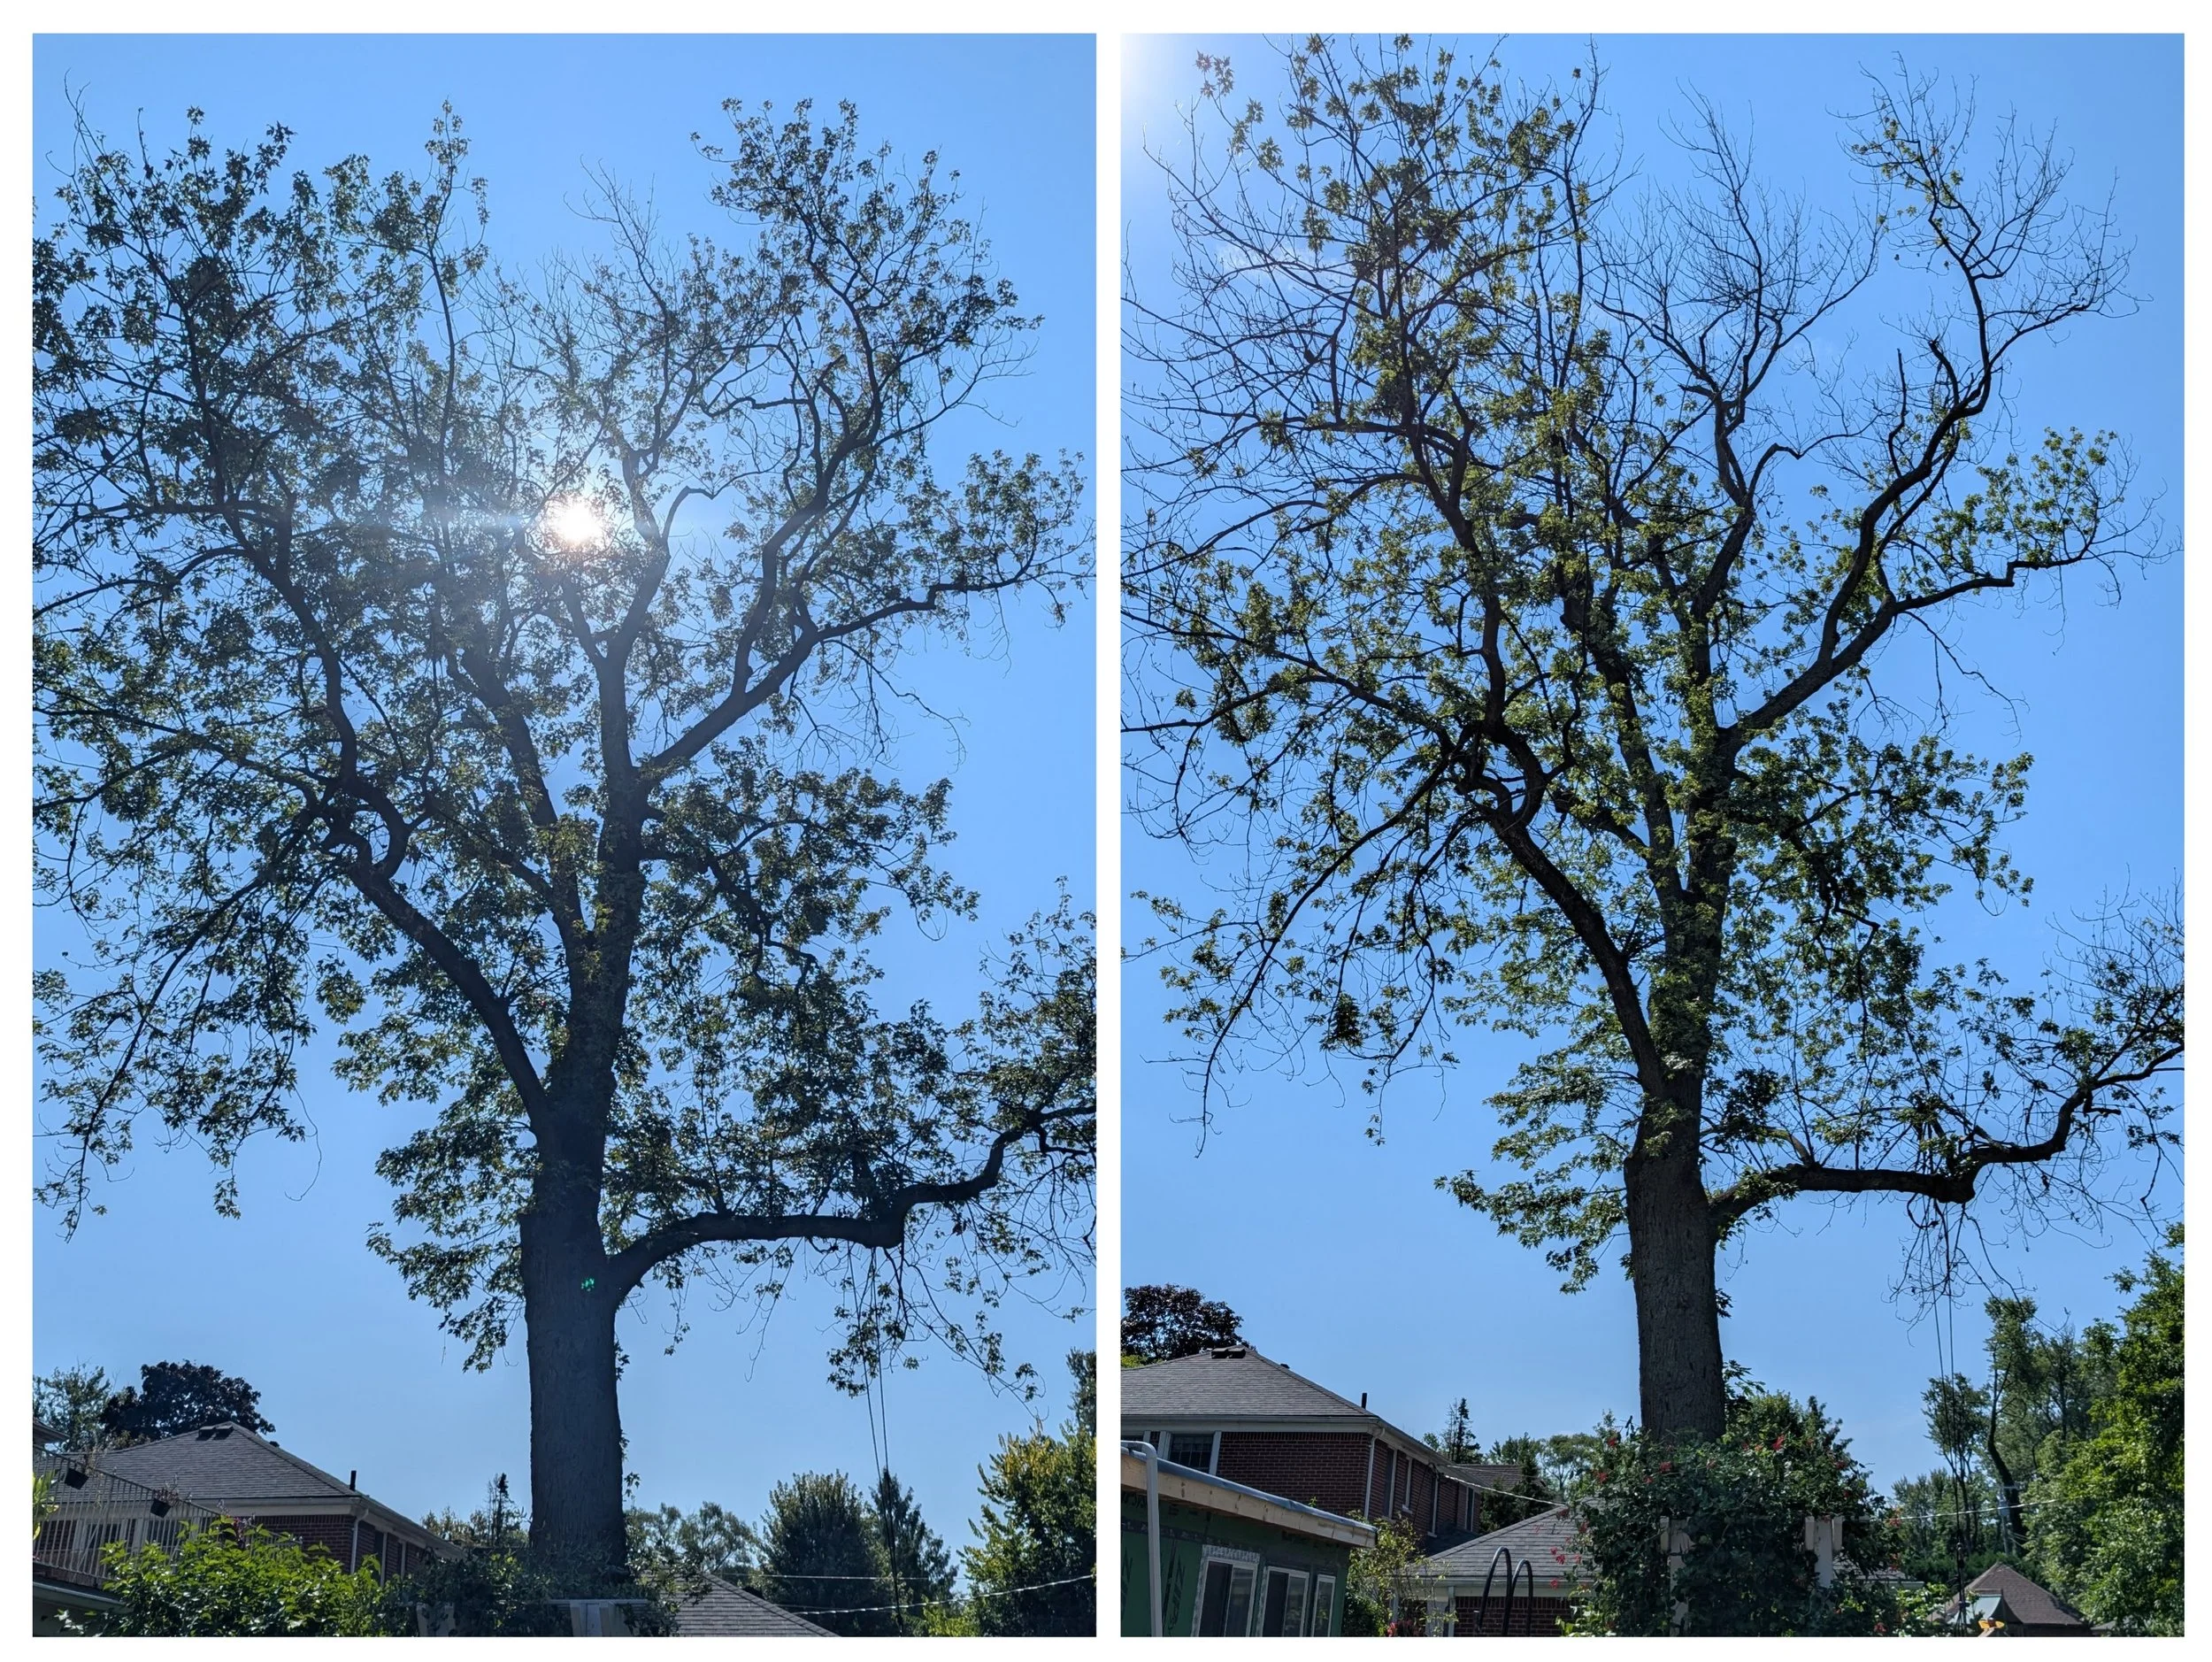
One year between the two photos. Left is first, right is second. Showing pretty clearly a negative net leaf area.
There are probably more rigorous, scientific ways to examine this. But in a loose sense, stand back from the tree.
This silver maple had a new patio installed basically right onto its root plate, affecting about 60% of its root space. Two years after the fact, we were called to check in on this tree.
The photo on the left is when we first saw the it. Around this time, we gave it some treatments to see if we could stabilize it; but it resisted the treatments. Perhaps we slowed down the net leaf loss, but its decline was pretty steep and rapid regardless. A very clear indicator of a negative net leaf area.
Here’s an example of a tree that has a positive net leaf area:
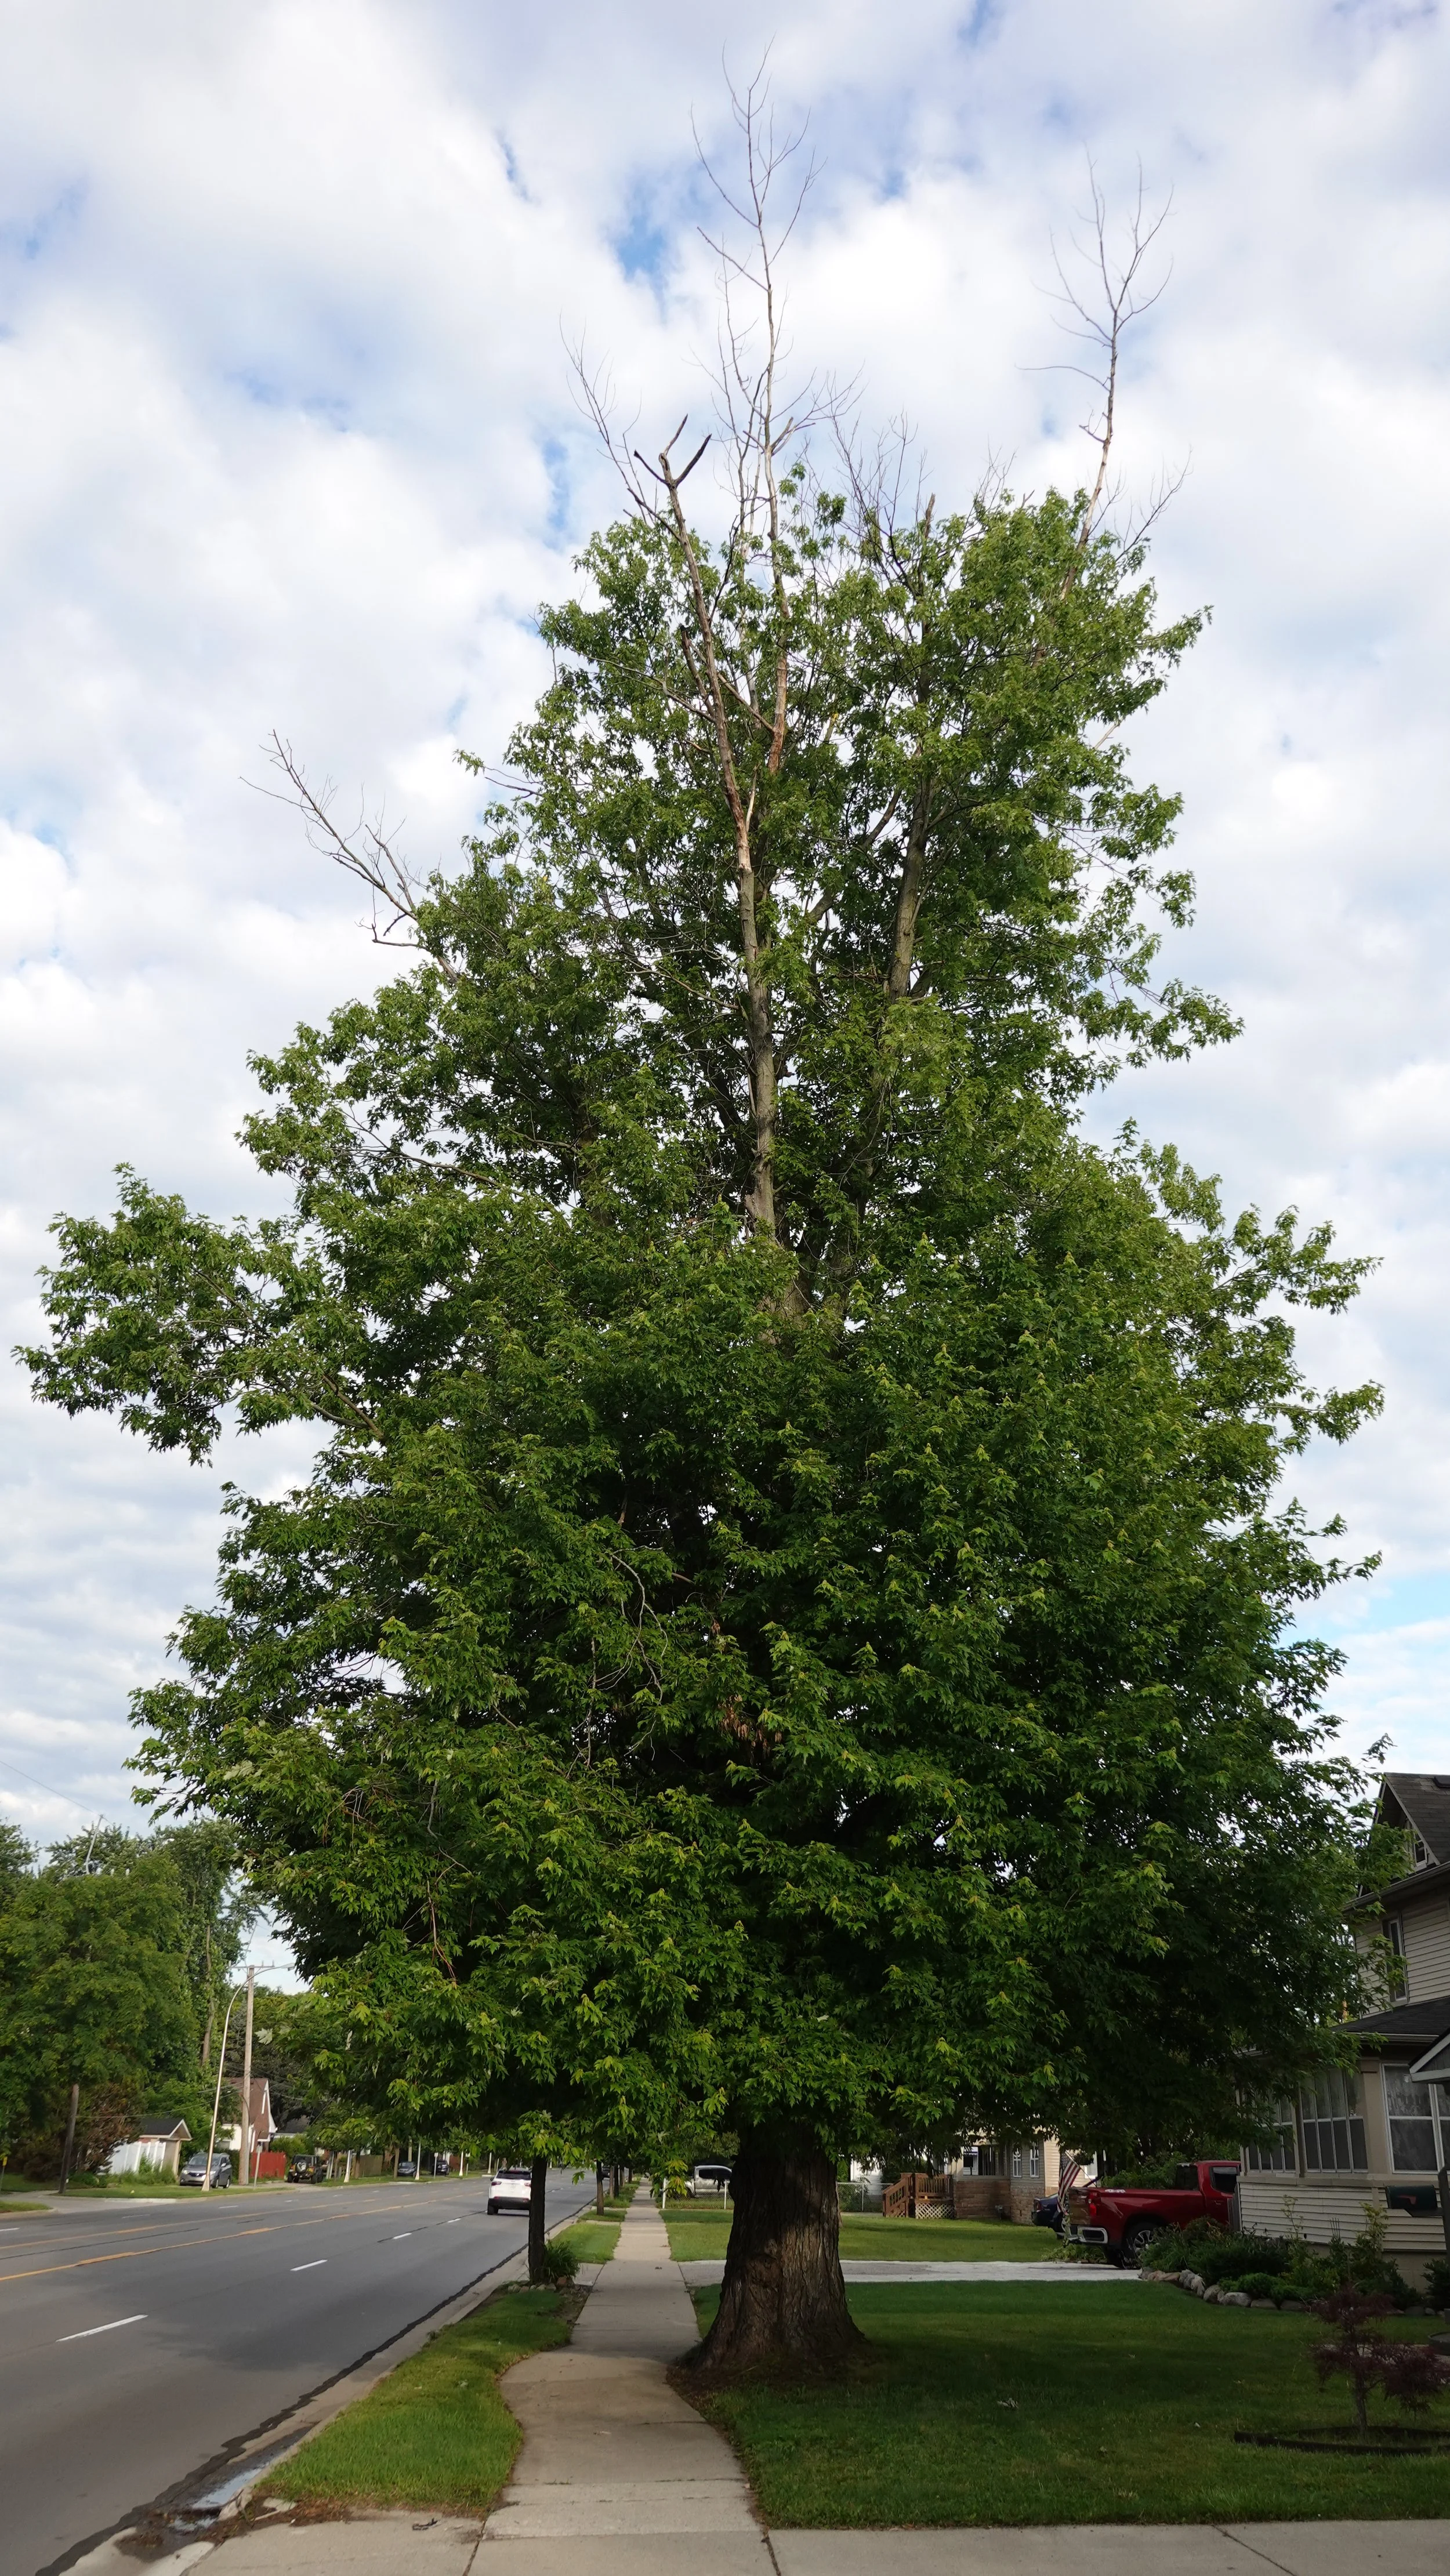
Classic silver maple resisting decline. Their ability to sucker out makes them capable of relatively rapid retrenchment.
This tree’s got some peripheral dieback at the top of its crown, but look at how full its lower crown is. Tons of tons of established epicormic stems.
Again, loosely, does this tree appear to be GAINING leaf area? Sure it is losing some up at the top, but we’re looking at the living parts of the tree mostly. Tons of new growth. Leaf size and color and shape all appear normal. So overall, I’d say this tree has a positive net leaf area, despite the dysfunction.
You’re sort of comparing the rate of decline with the rate of new growth.
Net Leaf Area.
A longer timeline
Net Leaf Area is contextual. Remember this from that article we wrote back in 2022?
The main article goes over this concept in more detail, and you should check it out. It’s cool I get to pull it up and use it again because lowkey I thought this went under the radar and I worked really hard coming up with this idea. Feels cool to have another use for it.
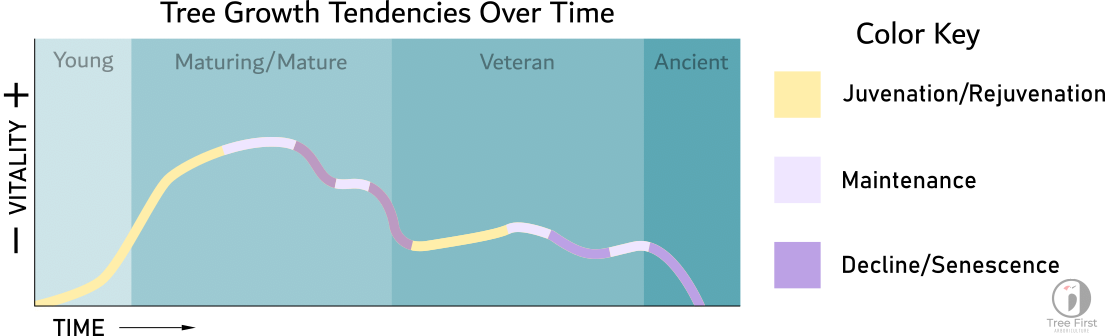
From the 2022 article on visualizing aging trees.
This is a graphic representation of a potential tree’s lifespan over time. We’ve got vitality on the Y axis, you might call that Net Leaf Area for this example, and time on the X axis.
The color of the curve changes as its angle or pitch does. As it goes up over time, I called it juvenation or rejuvenation if it happens later on in the timeline.
During this upward, yellow part of the curve, the tree has a positive net leaf area. Its crown, overall, is expanding. Maintenance might be just sorta netting out. Using up the same amount of carbs as it is storing. And decline and senescence, the deep purple, is when it is a negative net leaf area.
This graph is just a concept to illustrate the ebbs and flows of a tree of its lifespan.
These trends happen naturally or with the help of good arborists.
As a side note, I just noticed something. At the bottom of that article, you can see a big PDF of the different life stages of trees. That was a prototype that eventually led to the creation of the Tree First Approach.
Trends
When we’re looking at a tree, we’re just looking at a single point along the line (unless you actually have photos or something I guess). Check this out:
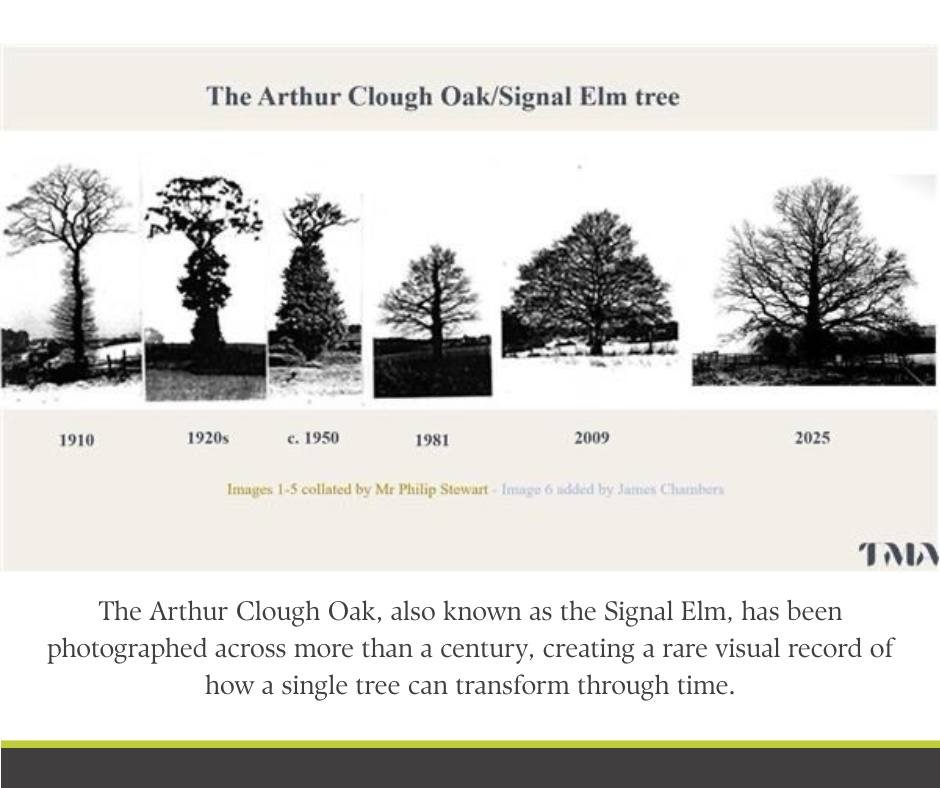
The Arthur Clough Oak we have the luxury of 100+ years of photos. Amazing and rare case study.
So how do we tell which way we’re trending on that imaginary line? Is the part of the line we’re looking at going up, down, flat, how do we tell?
Without looking at rings, or twig growth, or some other stuff, from a distance, by looking at a tree’s net leaf area, you can roughly determine where the tree might be on that imaginary line.
Up above, the 1910 and 1920s images, you might say this tree’s net leaf area is maintaining, or it is neutral. Losing leaf area in the upper crown, but gaining a lot of leaf area in the mid/lower crown.
From 1950 onward, it seems like the tree’s net leaf area is positive, and is now perhaps maintaining in current times.
The Clough Oak is such a classic piece of arboricultural study. Love using it.
And of course, one metric alone probably won’t tell us everything, right? But this is the first thing I check out and establish when I’m checking a tree out. It doesn’t have to be all that rigorous either. One thing to look at among many.
A broad trend that describes the trajectory of the tree’s health in the short term.